Zabbix Overviews
Zabbix is an all-in-one monitoring solution that allows users to collect, store, manage and analyze information received from IT infrastructure, as well as display on-screen, and alert by different means of communication when thresholds are reached. Zabbix allows administrators to recognize server and device problems within a short period of time and to reduce the system downtime and risk of system failure. It’s known for high performance, flexibility, and powerful data processing capabilities
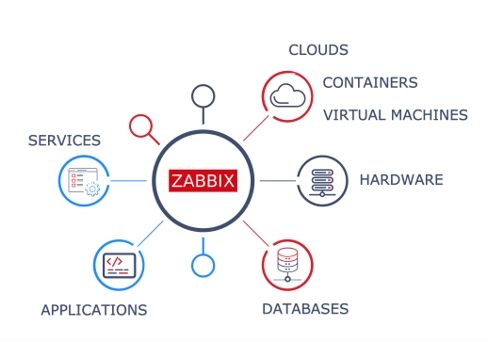
METRIC COLLECTION: from any devices, systems, applications
Metric collection methods: multi-platform Zabbix agents, SNMP and IPMI agents, agent-less monitoring of user services, custom methods, calculation and aggregation, end user web monitoring, and variety of other options
PROBLEM DETECTION: ability to define smart thresholds
Detect problem states within the incoming metric flow automatically. No need to peer at incoming metrics continuously. Highly flexible definition options. Separate problem conditions and resolution conditions. Multiple severity levels. Root cause analysis. Anomaly detection. Trend prediction
VISUALIZATION: single pane of glass
The native web interface provides multiple ways of presenting a visual overview of your IT environment: widget-based dashboards, graphs, nested dynamic network maps, slideshows, drill-down reports
NOTIFICATION: Be notified in case of any issues, guaranteed
Inform responsible persons about occurred events using many different channels and options: send messages, let Zabbix fix issues automatically, escalate problems according to flexible user-defined Service Levels, customize messages based on recipient’s role, customize messages with runtime and inventory information, save yourself from thousands of repetitive notifications and focus on root causes of a problem with Zabbix Event correlation mechanism.
SECURITY AND AUTHENTICATION: Protect your data on all levels
Strong encryption between all Zabbix components. Multiple authentication methods: Open LDAP, Active Directory. Flexible user permission schema. Zabbix code is open for security audits
AUTO-DISCOVERY: Automate monitoring of dynamic environments
Take automatic actions upon adding/removing/changing elements. Network discovery: periodically scans network and discovers device type, IP, status, uptime/downtime, etc, and takes predefined actions. Low-level discovery: automatically creates items, triggers, and graphs for different elements on a device. Auto-registration of active agent: automatically starts monitoring new equipment with Zabbix agent.